Education●●Solid
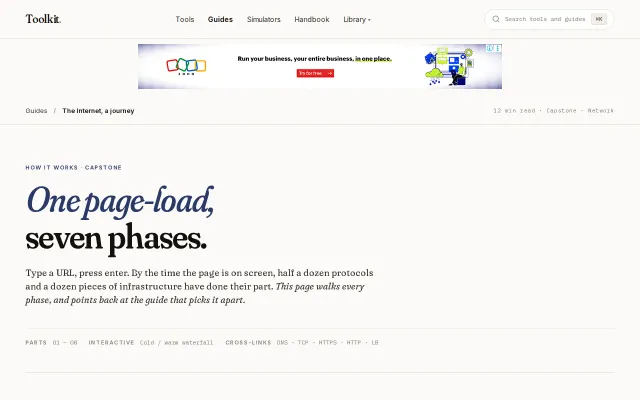
What happens when you load a webpage (Interactive)
Interactive waterfall with cold/warm toggle beats static 'how HTTPS works' comics.
Rabbit HoleEye CandyBig Brain
otterwilde2
3291mo ago
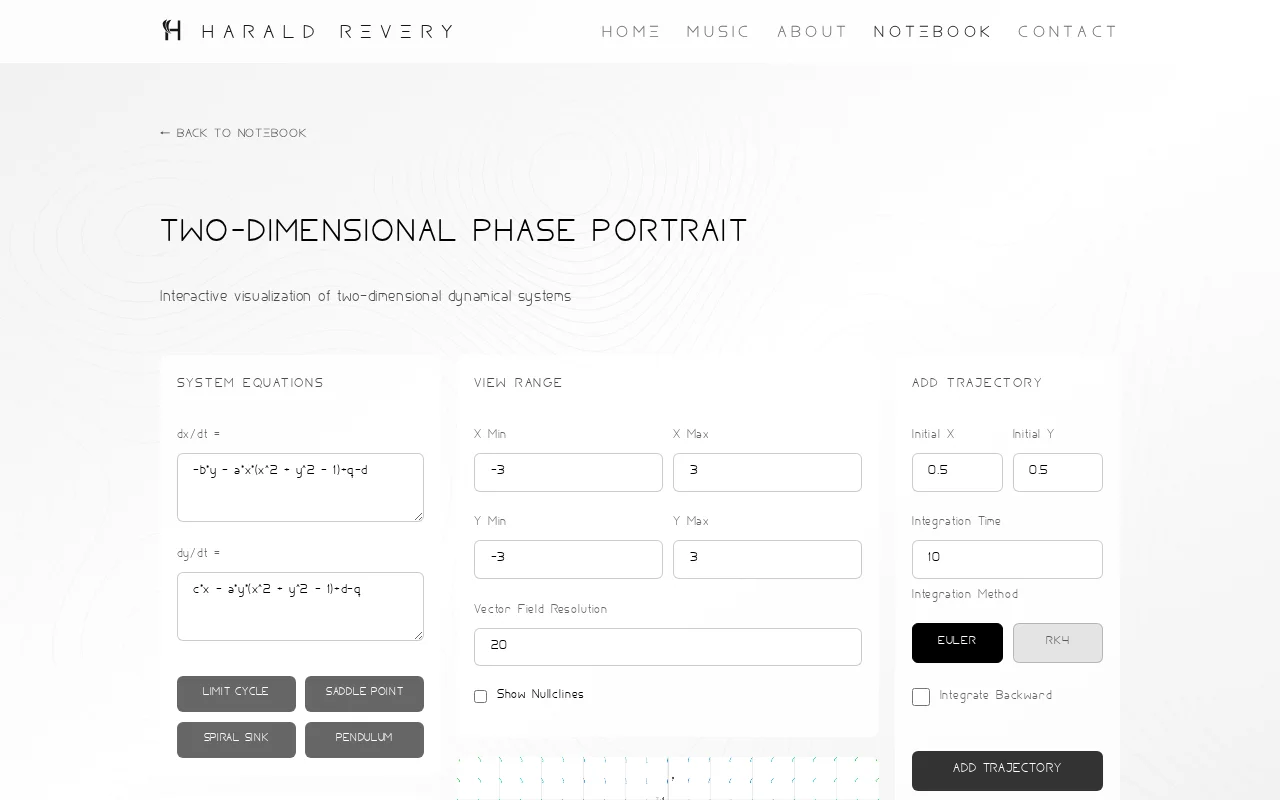
Paste your dx/dt and dy/dt, tweak parameters, and the page will draw vector fields, nullclines, trajectories (Euler or RK4), and even compute eigenvalues and a Poincaré index at clicked points — all in the browser. Not groundbreaking compared to MATLAB/pplane or Python notebooks, but packing Jacobian eigenanalysis, nullcline overlays and clickable stability diagnostics into a lightweight client-side tool is genuinely handy for teaching and quick exploration.
Students and educators in dynamical systems, applied mathematicians, physicists, control engineers, and hobbyists wanting quick visual exploration
Purpose: If you don't have any study guide for exercises related to dynamic systems or too lazy to run python and set up sliders to visually see potential bifurcations, you can play around with said dynamic system (numerically) to visually get a feel of the system.
It includes numerical approximations for:
- Euler/4th Order Runge-Kutta solver for the system --> You can also pick initial point + backwards integration.
- Poincaré Index (index theory)
- Nullclines
- Eigenvalues of the Jacobian matrix (sometimes called "stability matrix" in the literature)
It's based on old python code that I made for a dynamic system course that I converted to JavaScript using Grok, Sonnet 4.5 and Gemini Pro.
Does not include:
- Bifurcation diagrams - can't make it without a computer algebra system (CAS), way above my skill level...
- Anything that isn't two-dimensional (for one dimension you can just use a regular calculator) - 3D got highly computational heavy fast (for a website so to speak). I'm keeping it simple since it is a practice tool to draw your own phase portraits yourself by hand (like most exams requires you to do).
For real applications, you need to either solve stuff analytically or use more advance tools. This is just for educational purposes and enjoyment.
Interactive waterfall with cold/warm toggle beats static 'how HTTPS works' comics.
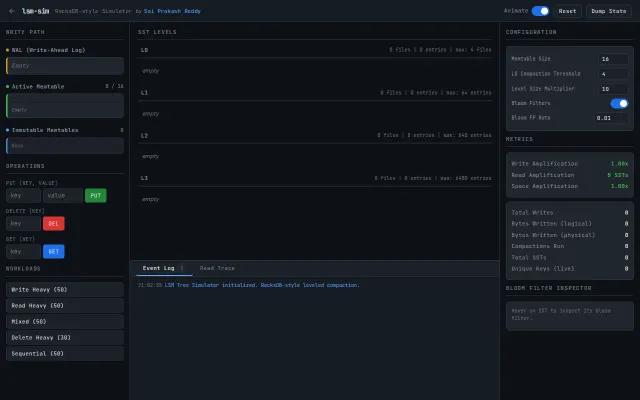
This actually simulates the full write path — WAL to memtable to immutable flush — and animates cascading leveled compactions so you can watch key movement and file counts in real time. The live bloom-filter checks and amplification metrics are the parts that will teach you something immediately; it's clearly built as a learning/debugging sandbox rather than a production profiler.
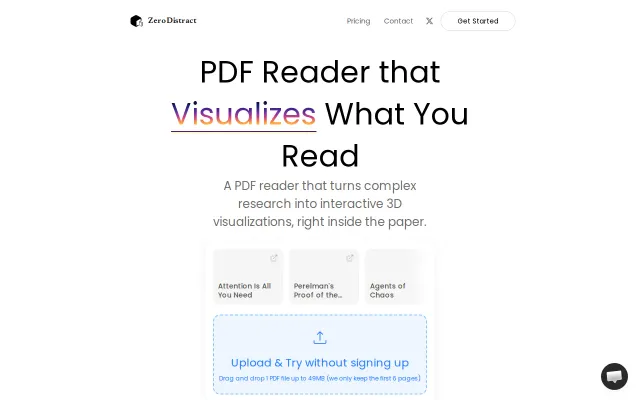
Interactive 3D visualizations inside PDFs—slick, but unclear if LLM-generated visuals aid actual comprehension.
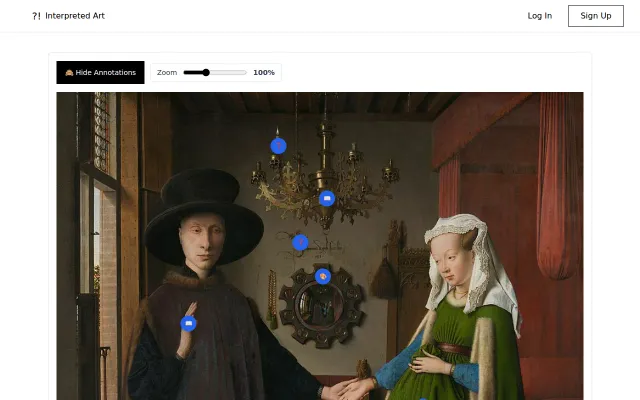
Art annotation demo, but no product substance—single example, unclear how content is sourced or scaled.
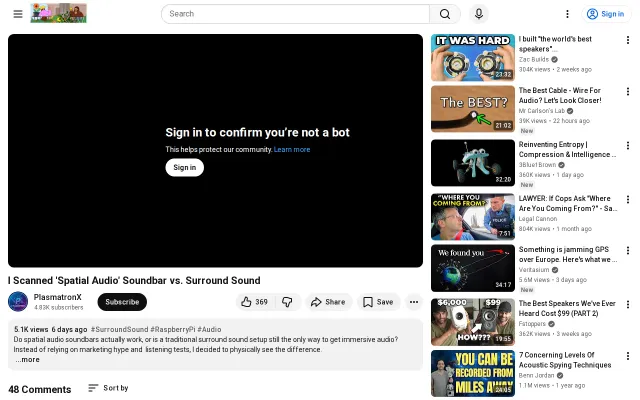
Open-source acoustic camera built on a Pico 2W visualizes sound waves directly.
Three.js renders real GPT-2 attention patterns you can actually explore interactively.