AI/ML●●Solid
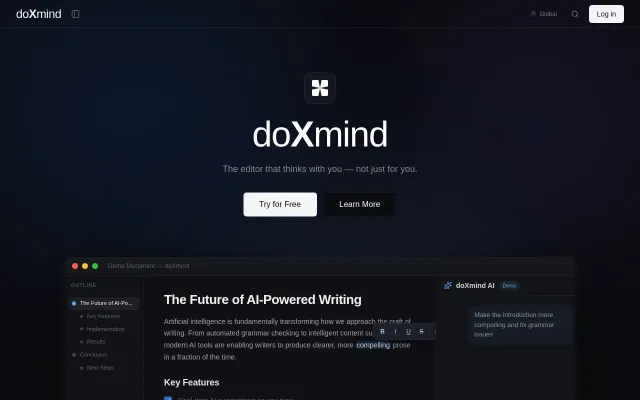
doXmind – for people who want docs, not all of Notion
Inline diff review for AI edits beats Notion's black-box rewrites.
SlickSolve My Problem
wangzhangwu
223mo ago
Notion + Grafana + GitHub PRs merged into one; live metrics next to context.
Engineering and infrastructure teams, technical organizations managing internal documentation and observability
Notion · Grafana · Confluence
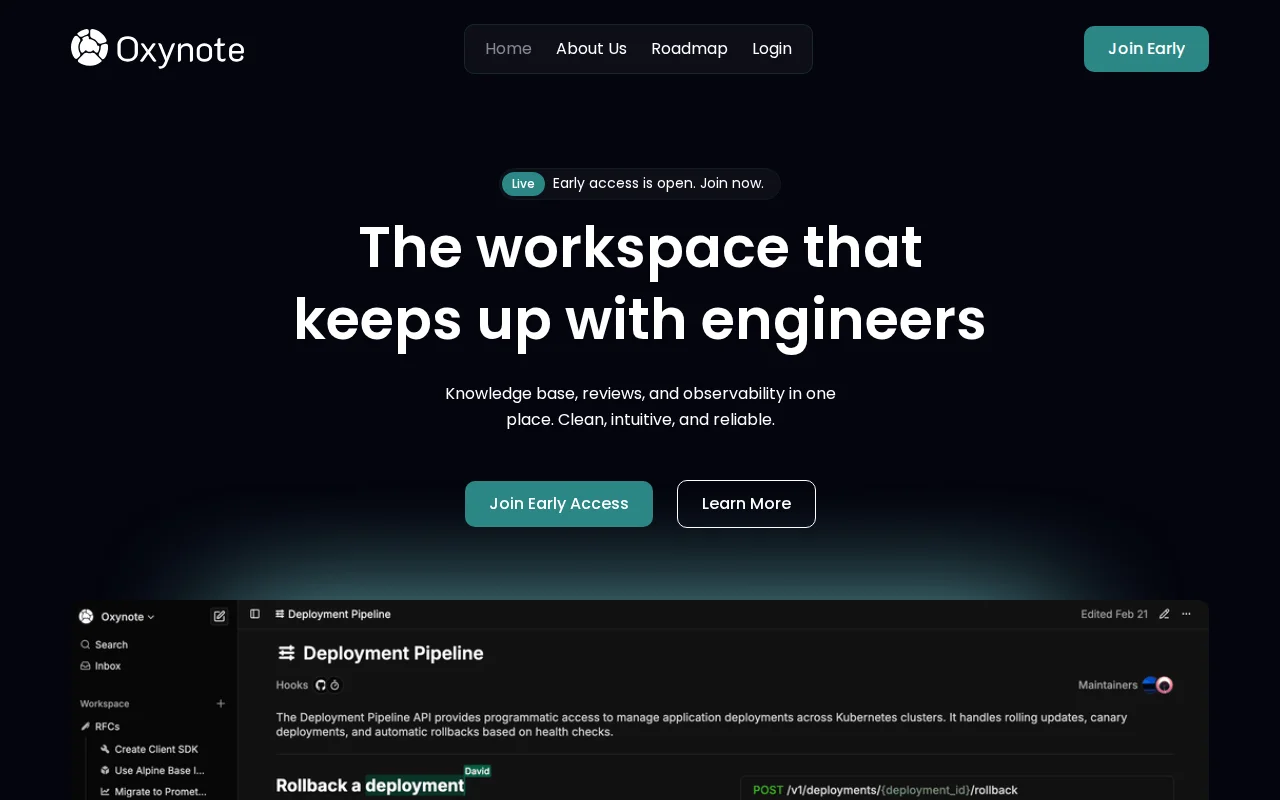
I wanted to share a project my friend Dovydas and I (Simon) have been working on for a while. It’s a knowledge base platform built specifically for developers and technical teams.
It has a similar feel to Notion and supports live collaboration, but it also has technical "power blocks" for API specs, runbooks, RFCs, as well as live metrics from external sources like Prometheus. On top of that, document changes can be reviewed like GitHub PRs, while still preserving rich text blocks and chart displays. The simplest way to describe it is: what if Notion, Grafana, and the PR review parts of GitHub were merged into one platform?
We started working on this because we realised Grafana is good at showing you that something is happening, but it’s not great at telling you why you should care, what "normal" looks like, or which runbook / decision / incident it relates to (it has description fields, but they’re fairly limiting). If you didn’t build the dashboard, you usually end up asking the person who did. Also: dashboards tend to get changed quietly, and the explanations (if they exist) usually don’t.
At the same time, Notion/Confluence work well for text, but they’re awkward for technical artefacts (runbooks, RFCs, postmortems, API specs), and the review features feel superficial. That’s why a lot of people, ourselves included, fall back to git-based docs. Git-based docs are closer to how engineers work, but then you’re running a docs "product" (Docusaurus / GitBook / etc.) with pipelines and deployments, auth layers, and live collaboration on long-form writing that’s rarely pleasant. And, of course, observability still sits somewhere else.
So we built Oxynote. It’s a technical knowledge base for dev + infra teams, with a bias towards simplicity (we took a lot of inspiration from Linear and the idea that you shouldn’t need a training session to use a tool). It keeps runbooks, procedures, API design docs, RFCs, and postmortems together with a proper review flow, and lets you put relevant metrics charts right next to the text. It also has a feature we call "freshness hooks", which lets you tie docs to related GitHub repos / Docker images / external websites, so you get a nudge when something there changes.
This is still an early-stage platform and we’ve got a lot we want to add. For example, live metrics charts currently support only Prometheus, but we’re planning to add SQL databases and other data sources next.
It’s completely free and there are no ads. We’d really appreciate suggestions, experiences (positive and negative), and ideas. Thanks!
Inline diff review for AI edits beats Notion's black-box rewrites.
Yet another AI knowledge base inspired by Den, but open-source.
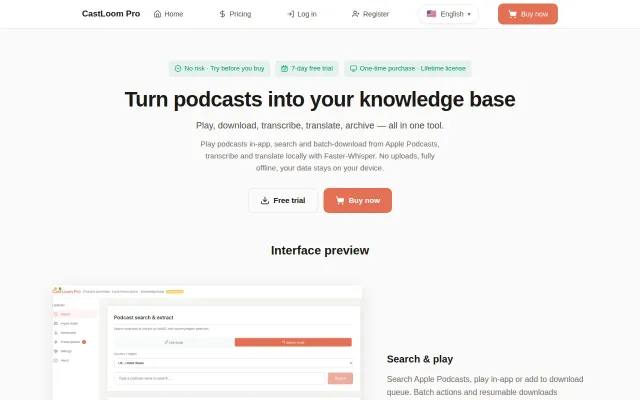
Local podcast transcriber for Windows that pushes transcripts straight to Obsidian or Notion.
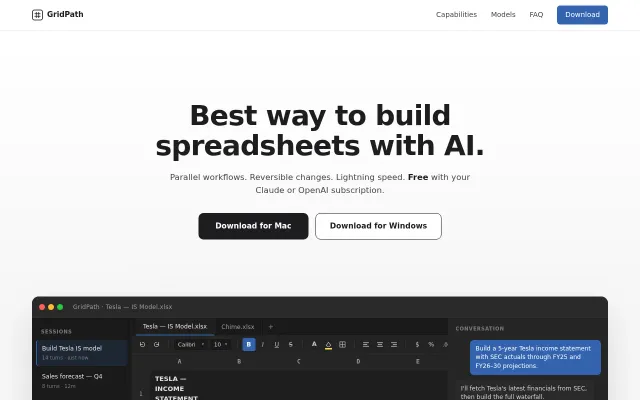
2.5min Tesla model build beats Excel plugins, but AI spreadsheets are getting crowded.
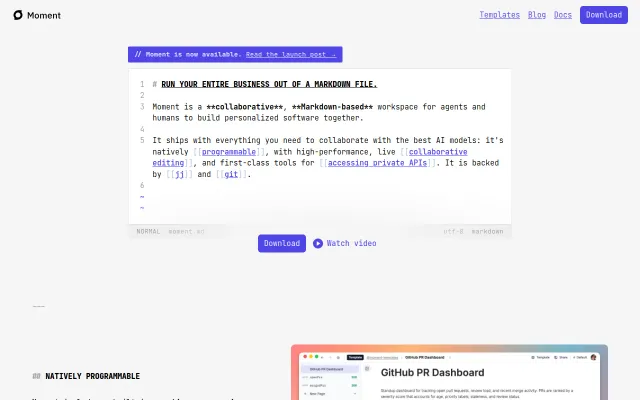
Git-backed Markdown workspace with live React—lets Claude agents build custom UI while keeping source auditable.
Vega-Lite specs to editable Excalidraw charts when native only does bar charts.