Developer Tools●●Solid
Visualize Git commit histories as animated force-directed graphs
Commits as force graphs over time. Hypnotic but missing actual insights: why branches diverge, merge velocity.
Eye CandyRabbit Hole
wwhxd
623mo ago
Fast & efficient WebGPU-accelerated graph visualization library
WebGPU force-directed graphs, but Sigma.js, Cytoscape, and D3 already dominate this space.
Data visualization engineers, graph DB tools, network diagram builders
Sigma.js · Cytoscape.js · D3.js
Commits as force graphs over time. Hypnotic but missing actual insights: why branches diverge, merge velocity.
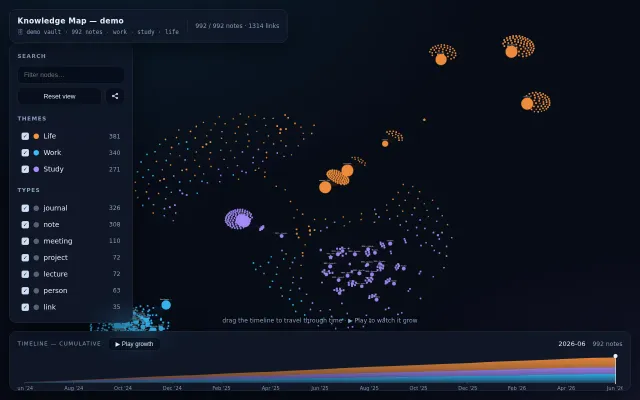
Timeline scrubbing shows your knowledge graph grow, unlike Obsidian's static view.
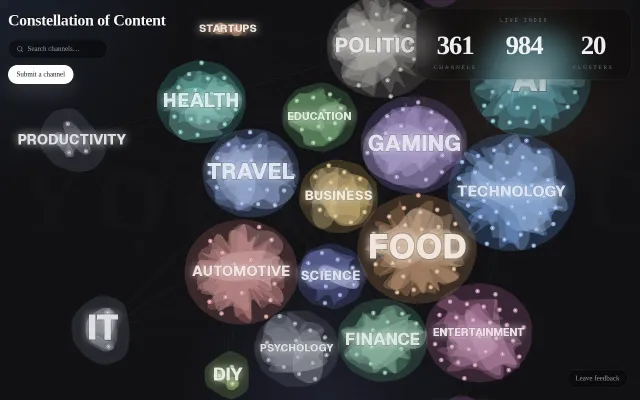
Pretty visualization but YouTube discovery is already solved by the platform itself.
Oren-Nayar BRDF solves opposition surge correctly where standard PBR fails completely.
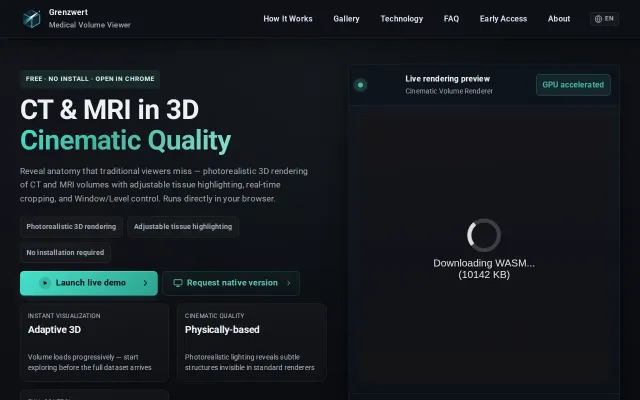
Desktop-grade DICOM volume rendering in Chrome with WebGPU—no installation needed.
PyMOL's 1000x faster core in Rust—same commands, modern GPU rendering, no legacy C++ baggage.