Developer Tools●●Solid
Cost per Outcome for AI Workflows
Cost attribution per event via OpenTelemetry, but Anthropic Workbench and Vercel do this already.
Solve My ProblemBig Brain
deborahjacob
443mo ago
Feature-level AWS cost attribution for Python
One decorator reveals which feature burned $2,800 instead of two-day forensics.
Python backend teams running AWS+LLM inference who need per-feature cost visibility
CloudHealth · Vantage · CloudZero
```bash pip install spendtrace ```
python
```python import spendtrace spendtrace.auto_instrument() # patches boto3, openai, anthropic at startup
from spendtrace import cost_track
@cost_track(feature="ai_recommendations") def recommend(user_id): items = dynamo.get_item(...) # captured response = bedrock.invoke_model(...) # captured return response ```
That's the whole install. No proxy, no sidecar, no config file. One decorator per feature entry point and every boto3 and LLM SDK call inside it is attributed automatically. Then: python
```python for row in storage.aggregate_by_feature(): svc = row["service_costs"] print(f"{row['feature']:<25} bedrock=${svc.get('bedrock',0):.4f} dynamodb=${svc.get('dynamodb',0):.4f} total=${row['total_cost']:.4f}") ```
``` ai_recommendations bedrock=$0.7140 dynamodb=$0.0010 total=$0.7150 search bedrock=$0.0000 dynamodb=$0.0410 total=$0.0420 batch_processing bedrock=$0.0000 dynamodb=$0.0003 total=$0.0003 ```
The number that kept surprising people when I showed them this: `ai_recommendations` at $0.717 per call vs `search` at $0.042. Same product, 17x cost difference, nobody had ever seen that comparison before. A few things that took more thought than expected: The context propagation. When `search` calls `product_details` which calls DynamoDB, those reads should be attributed to `product_details` for debugging — but a product manager asking "what does search cost?" wants the fully-loaded number including everything it triggered. We store both. `parent_tx_id` on every transaction lets you reconstruct the full call tree:
``` api subtree=$0.018101 search subtree=$0.014000 product_details subtree=$0.003000 (×3) cache subtree=$0.000100 ```
The reconciliation problem. Your modelled costs (rate × count) will always drift from what AWS actually charges because the pricing API doesn't capture reserved capacity, data transfer, support plan, or volume discounts. We pull Cost Explorer by service (DynamoDB separately from S3 separately from Bedrock — not the blended total) and compute a per-service calibration factor. You can then restate historical records in one call if the model was off. The per-tenant angle. Add `user_id` to your request boundary and every nested call inherits it automatically through Python's `contextvars`. So you get cost per customer without instrumenting every function: python
```python @track_request(endpoint="/api/search", user_id=current_tenant_id) def handle(query): return search_products(query) # all nested costs go to this tenant ```
``` tenant-acme $47.21/month (8,341 requests) tenant-globex $12.88/month (3,102 requests) ```
This is exact attribution from the call stack, not inference from billing tags. What it doesn't do: It's not a proxy, not a dashboard (SQLite backend, self-hosted), not multi-cloud yet (AWS first, going deep before going wide). The `/metrics` endpoint exposes Prometheus counters if you want to alert on spend rate in Grafana. Code and README: https://github.com/Joshyi-Abini/Spendtrace Ask me anything about the context propagation design — it's the part I'm most proud of and most likely got wrong in ways I haven't found yet.
Cost attribution per event via OpenTelemetry, but Anthropic Workbench and Vercel do this already.
Finally, topic-level Kafka cost attribution without Confluent's enterprise pricing.
No-proxy LLM cost tracking beats Helicone for teams avoiding traffic rerouting.
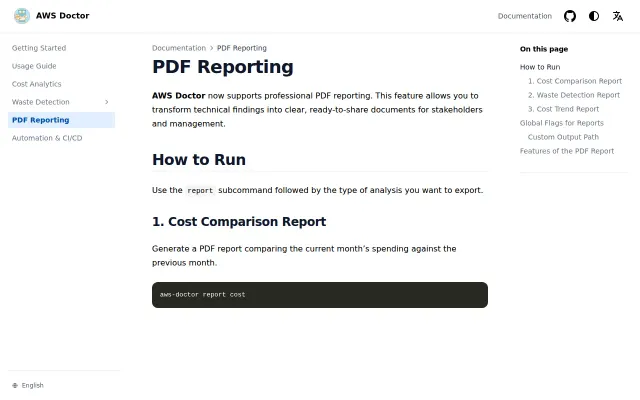
Adds PDF report generation to AWS cost CLI, but cost tools are crowded.
Z3 solver in WASM proves idle resources mathematically without sending data to servers.
Yet another AWS SDK when boto3 v2 is already async-native and typed.