Data●Mid

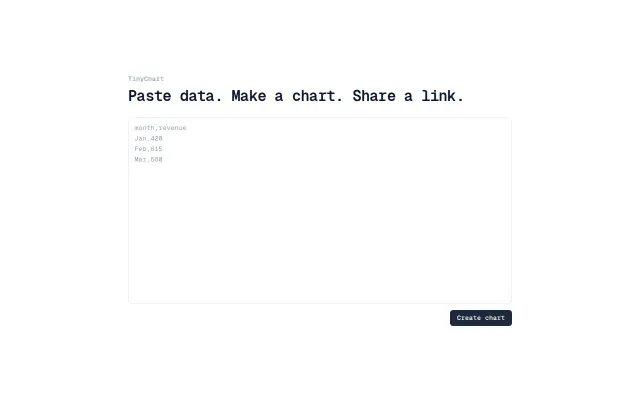
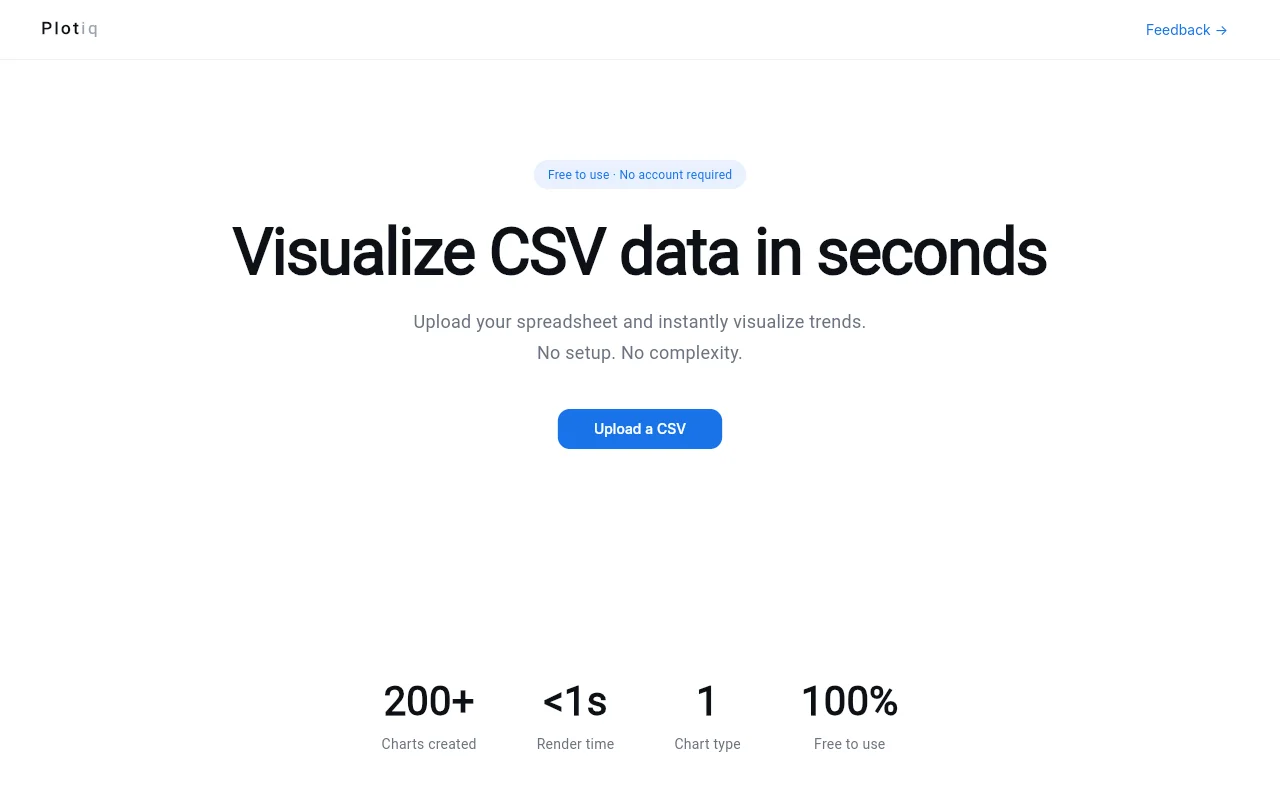
Plotiq – Turn CSV files into graphs instantly
Instant CSV-to-chart conversion without signup or complex configuration settings.
Ship It
devnpatel
743mo ago
CSV to chart in seconds, but Plotly, Google Sheets, and Metabase already own this.
Analysts, spreadsheet users, anyone needing quick CSV visualization
Plotly · Google Charts · Apache ECharts
Instant CSV-to-chart conversion without signup or complex configuration settings.
QuickChart and Google Charts already do no-signup CSV-to-chart better.
Clean CSV charting, but Datawrapper and Google Sheets already do this free.
Client-side data tools without signup, but Papaparse and a dozen alternatives already solve this.
Vega-Lite specs to editable Excalidraw charts when native only does bar charts.
Excel-to-dashboard automation, but Tableau and Power BI already do this better.