Developer Tools●Mid
IsGithub.Online
GitHub status wrapper that works when the official page is down.
Niche GemSolve My Problem
vednig
621mo ago
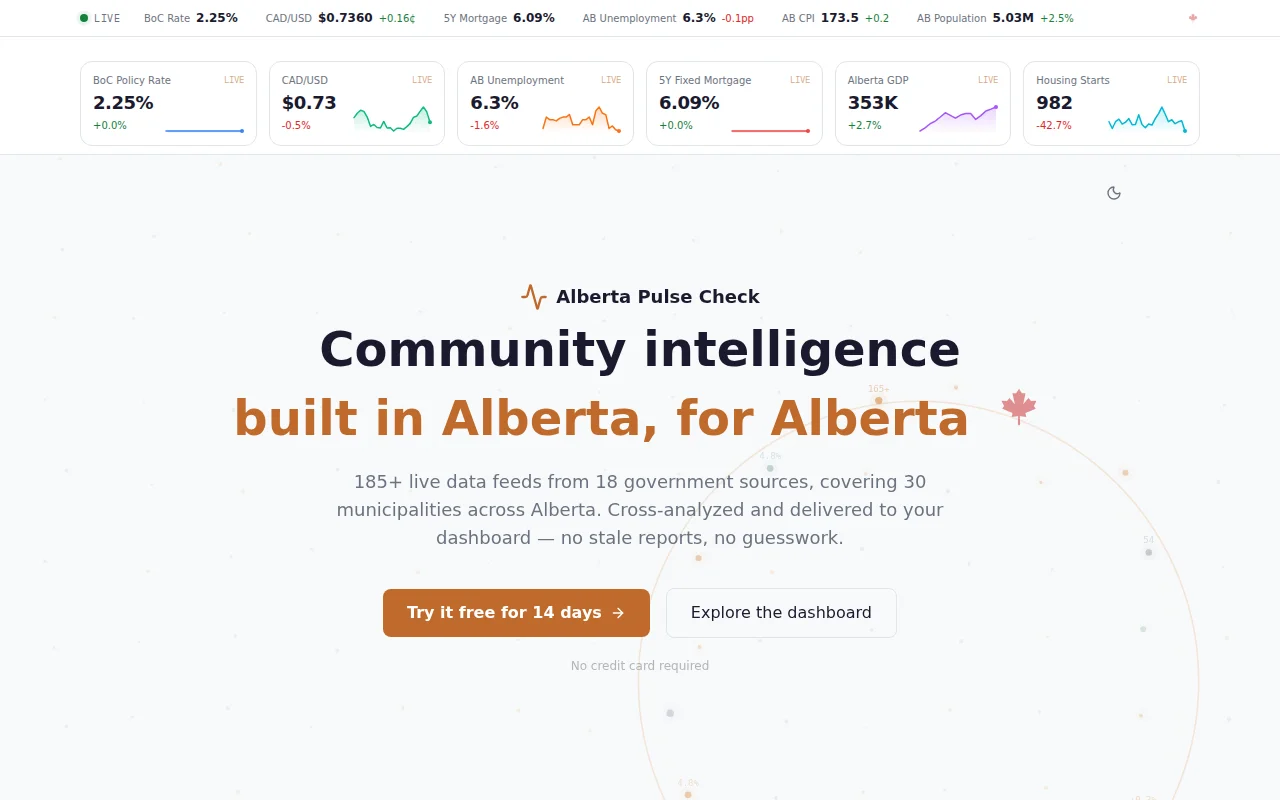
Regional economic dashboard, but public data aggregation isn't novel.
Alberta residents, real estate professionals, local investors, economic analysts
Statistics Canada Data Portal · FRED Economic Data · Local Open Data Portals
Data sources include Bank of Canada (rates, CAD/USD), StatsCan (GDP, CPI, unemployment), CER (pipeline throughput, oil/gas production — 16 feeds), AESO (electricity pool pricing), IRCC (immigration), municipal ArcGIS endpoints (22 municipalities with parcel-level data), Edmonton/Calgary Socrata APIs, and Alberta's regional dashboard (54 indicators for all ~340 municipalities).
Tech: Next.js 16, React 19, TypeScript, better-sqlite3, Recharts. All data fetched server-side from live government APIs. PostgreSQL fallback for upstream outages. ISR on embeddable chart routes.
The interesting technical challenge was normalizing data across very different government API formats — ArcGIS feature services, Socrata SODA, StatsCan's WDS SOAP-to-JSON API, fixed-width text files (AER well licences), and various CSV/JSON endpoints. Each municipality's ArcGIS has different field names for the same concepts (assessed value might be TOTAL_ASSESS, TOTALASSESSEDVALUE, Total_Value, etc.).
I live in Parkland County (west of Edmonton) and built this because I wanted economic indicators for my area without checking a dozen government portals. Planning to monetize the municipality deep-dives at $29/mo while keeping macro data free.
Happy to answer questions about the architecture or the government data landscape.
GitHub status wrapper that works when the official page is down.
Tracks jets, ships, satellites, and earthquakes live on one unified dark-ops map.
No-API dashboard is scrappy but offers little over Google News + Bloomberg terminals.
Multi-tool aggregator dashboard lands in crowded category; Zapier, Make, PagerDuty already own this.
Aggregates 60 OSINT feeds into one map with pseudonymous P2P comms built in.
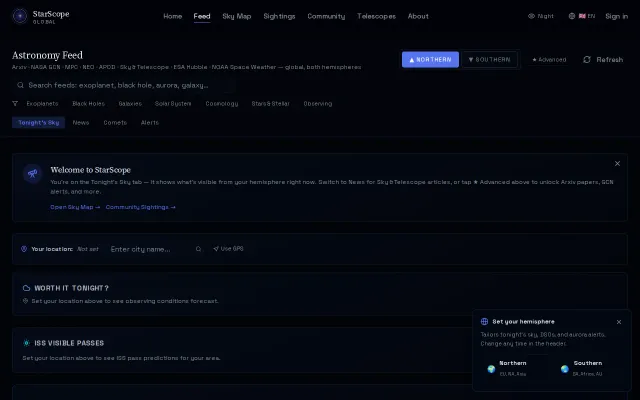
Finally an astronomy dashboard that doesn't assume you're in North America.