Design●Mid
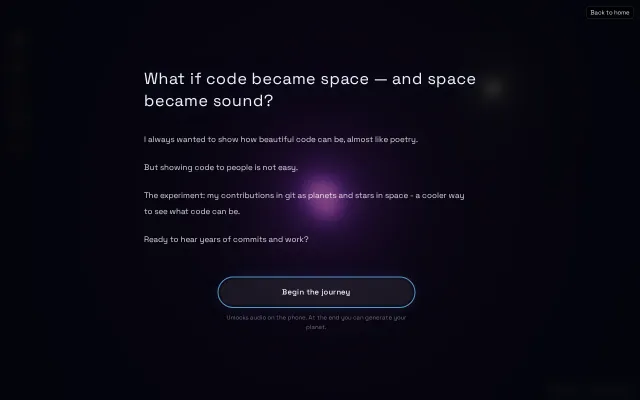
Coding Planets – turn GitHub contributions into sound and space
Three.js GitHub viz with audio, but another commit graph in a crowded field.
Eye CandyCozy
jnettome
412mo ago
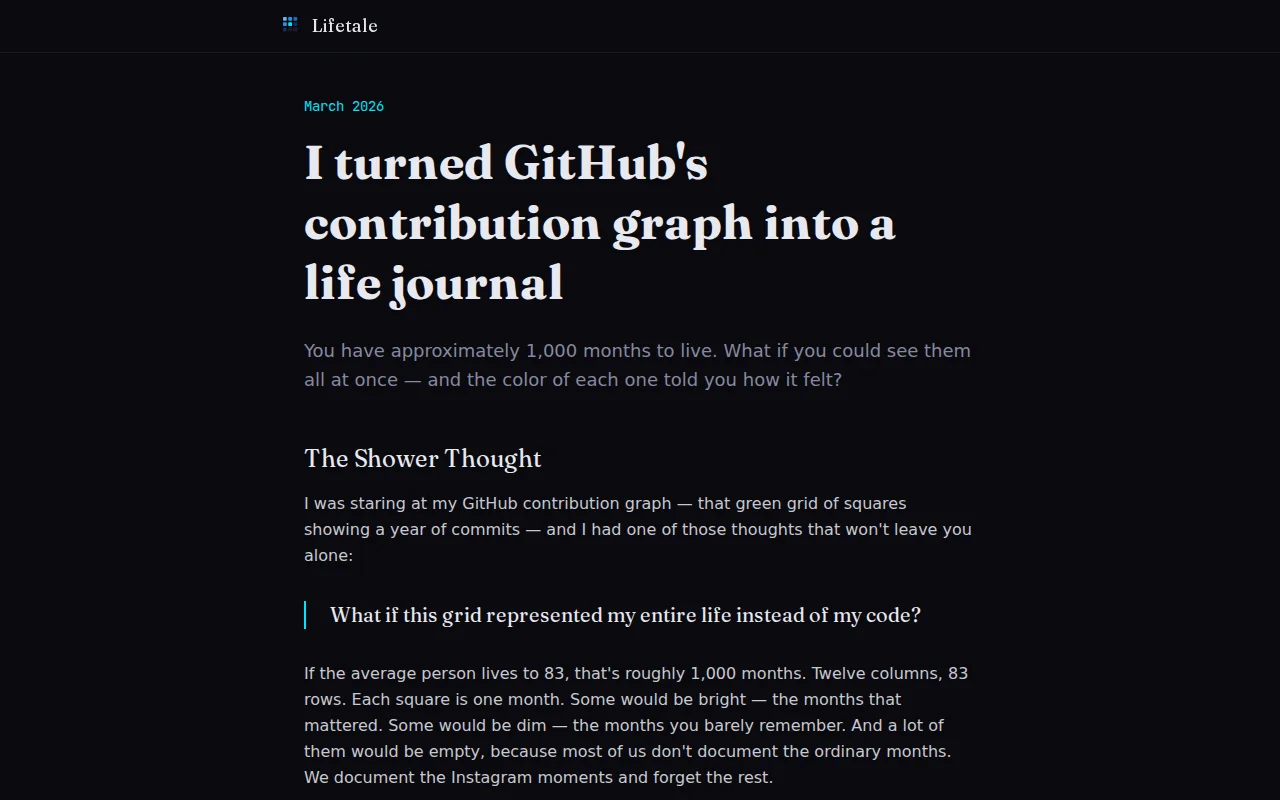
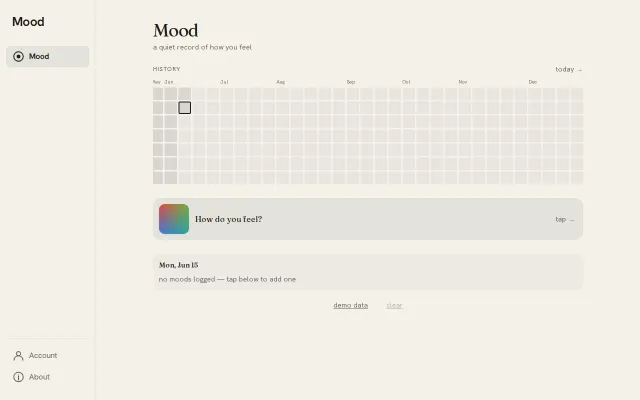
GitHub contribution graph for your life, colored by meaning instead of commits.
Developers and quantified-self enthusiasts seeking private life reflection.
Day One · Exist.io · Mooda
I'm George. I've built lots of business applications but never a personal application.
After staring at my GitHub graph, I realized my actual life doesn't have a contribution chart. My app, Lifetale, gives you ~1,000 squares (one per month of life), colored by how each month felt, not how much you posted. I wanted sharing to be opt-in and limited so you can create 'circles' to share specific days and memories with close friends and loved ones, but not the world.
Beta is live on TestFlight. Happy to send invites to anyone who wants to try it — just join the waitlist on the site.
Technical: Hono on CF Workers, D1, R2, React Native/Expo. Passwordless auth via Resend. Private posts stay in IndexedDB on device. Photo scanner is really fast and populates your grid in a few seconds using the EXIF data from the photos.
Would love feedback on the grid concept. The most surprising thing has been watching which squares people fill first.
Three.js GitHub viz with audio, but another commit graph in a crowded field.
Turns your commit history into a 3D planet with generative audio soundtrack.
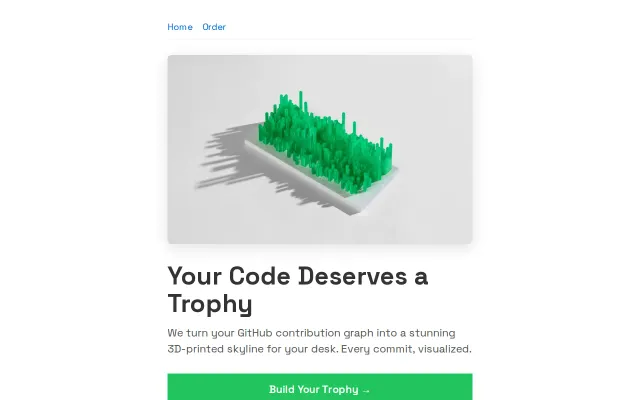
3D-printed GitHub graphs when gh-skyline already generates free STL files.
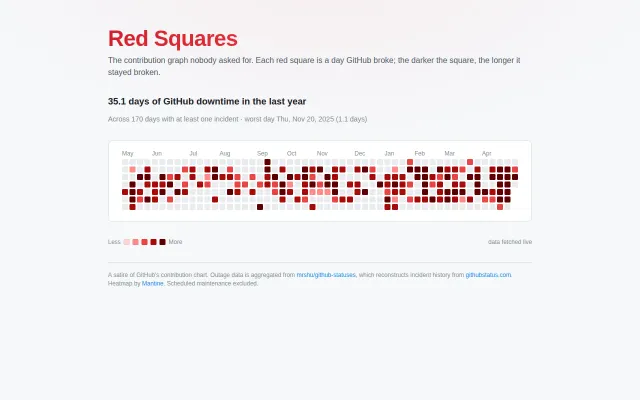
Clever satire flipping the contribution graph, but offers no actionable insights beyond status page data.
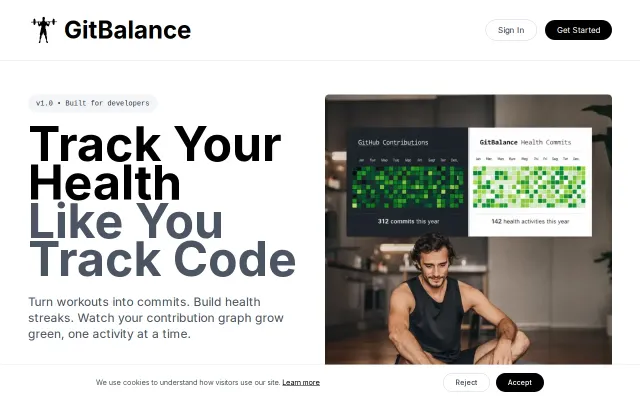
GitHub contribution graph for health when Habitica and Streaks already exist.