Data●●Solid
Praxis – Lab data to publication-ready figures in one Python package
Nature, Elsevier, RSC journal templates save hours of matplotlib formatting.
Niche GemCozy
zmtsikriteas
201mo ago
Py library to generate SVG visualizations of scientific data
CSS-themed SVGs are nice, but matplotlib and plotly already own this space.
Python developers creating scientific visualizations
matplotlib · seaborn · plotly
I wrote it as a fun project, mostly because I found that the standard libraries in Python generated unnecessarily large SVG files. One nice property is that I can configure the visuals through CSS, which allows me to support dark/light mode browser settings. The graphs are specified as JSON files (the repository includes a few examples).
It supports scatterplots, line plots, histograms, and box plots, and I collected examples here: https://github.com/alefore/mini_svg/blob/main/examples/READM...
I did this mostly for the graphs in an article in my blog (https://alejo.ch/3jj).
Would love to hear opinions. :-)
Nature, Elsevier, RSC journal templates save hours of matplotlib formatting.
Minimalist CSS framework—Pico, classless CSS, and Tailwind already own this space thoroughly.
90 CSS-animated SVG pets with zero JavaScript dependencies — charming and copy-paste ready.
Minimalist LaTeX CV template with a one-page variant, but Overleaf already owns this space.
AI-to-CSS animation pipeline beats hours of manual keyframe tweaking.
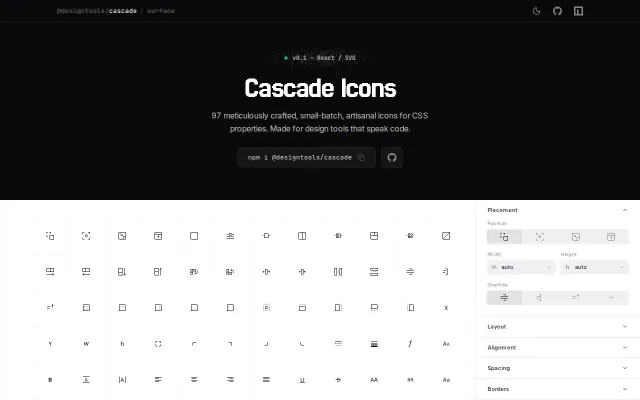
CSS property icons for design tools, but icon sets for dev UIs already exist.