Infrastructure●●Solid
Telescope now queries Kubernetes logs directly
Fills the kubectl logs gap—queries pods across namespaces when aggregation fails.
Solve My ProblemDark Horse
r0b3r4
904mo ago
A lightweight schema-on-read analytics in a single binary
Bridges grep and Splunk with single-binary deployment and SPL-compatible queries.
DevOps engineers and SREs
ClickHouse · Splunk · Quickwit
Server mode — persistent storage with full-text search (FST inverted index + roaring bitmaps), columnar segments with dictionary encoding and LZ4, and materialized views for precomputed aggregations. The query language is called Lynx Flow — a pipeline language where data flows left to right through |. If you know SPL, you'll feel at home. It also has partial SPL2 compatibility.
from nginx | parse combined(_raw) | status >= 500 | group by uri compute count() as hits, avg(duration_ms) as latency | order by hits desc | take 10
Quickest way to try it:
curl -fsSL https://lynxdb.org/install.sh | sh
lynxdb demo # streams sample logs from 4 sources lynxdb query 'from nginx | group by status compute count()'
Idle memory is around 50 MB. It accepts Elasticsearch _bulk, OpenTelemetry OTLP, and Splunk HEC, so you can point existing pipelines at it without changing anything. Fair warning: this is v0.1.3 and not production-ready. Storage format and APIs may change between releases. I'm using it for my own log analysis workflows and it works well enough there, but I wouldn't run it in prod yet. Written in Go. Interested to hear what you think — especially about the query language design and what you'd want from a tool like this
Fills the kubectl logs gap—queries pods across namespaces when aggregation fails.
Single binary replaces Plausible/Fathom stack; embedded DuckDB kills infra tax.
Single binary replaces Postgres, Redis, and ClickHouse stack for web analytics.
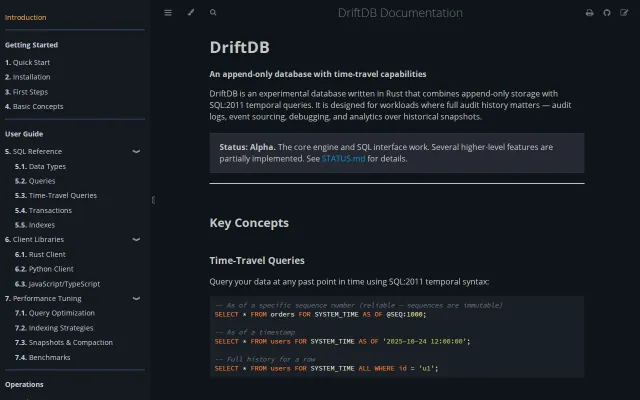
Time-travel SQL on append-only storage, but PostgreSQL temporal tables already exist.
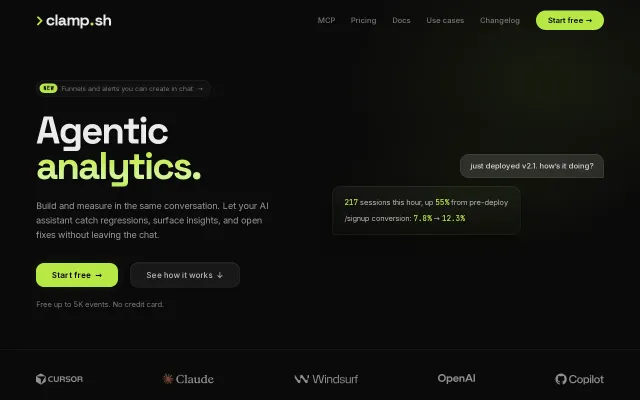
Analytics built for AI agents to query via MCP, not humans staring at dashboards.
Honest learning project in a solved category — Grafana Loki and Datadog already dominate.