AI/ML●Mid
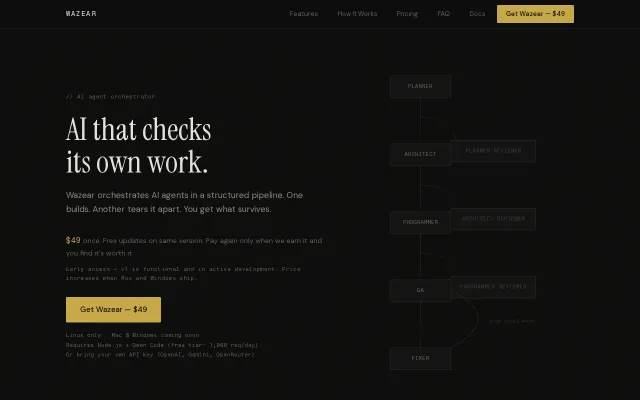
Wazear – A visual AI orchestrator where agents review each other
Yet another agent orchestrator, but the reviewer-pairing concept is at least novel.
Ship ItBold Bet
Vallar
502mo ago
Interactive essay mapping AI agent chaos to emergent org charts.
CTOs, engineering managers, and AI system architects
Distill.pub · Observable notebooks
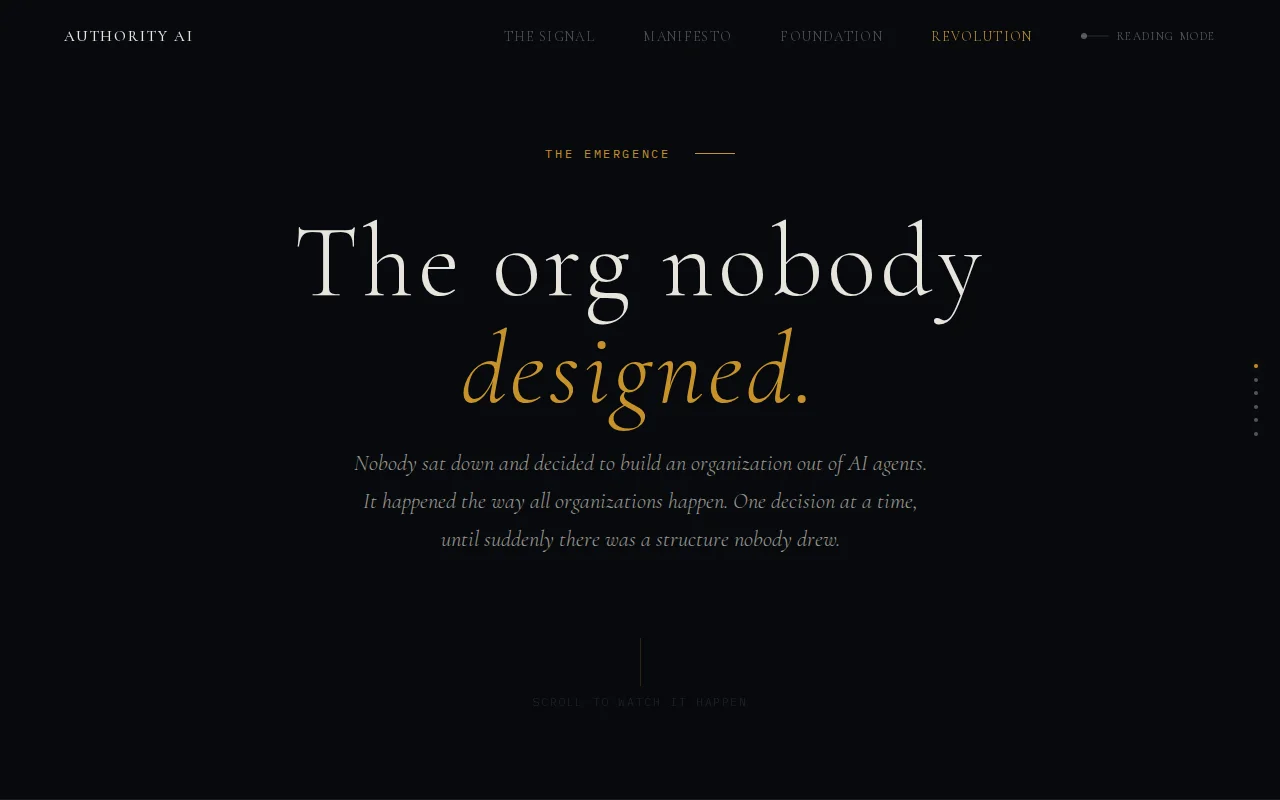
You start with one agent. It gets overwhelmed. You add more. They start routing to each other based on what works. Repeated behavior hardens into structure. Someone introduces an orchestrator to bring order. Some agents never get the memo. Some lose context when they get replaced. The orchestrator doesn't know what it doesn't know.
This is what is happening in most engineering organizations right now
So, I built an interactive visualization that walks through how this happens in six acts, from a single agent to a full emergent org chart. The visual starts center-out and transitions to a top-down hierarchy as structure forms. Failing agents flicker. Connections break. The orchestrator arrives and things look better than they are.
The point of the piece is that the org chart your engineers could draw and the org chart that is actually operating are not the same document. Teams have the tooling to observe individual agents. Nobody has the layer that tells you what the system as a whole has decided, committed to, and authorized.
Built with canvas, IntersectionObserver-driven scroll, and a layout interpolation between radial and tree positioning that transitions across acts.
Has anyone here has hit the governance wall with agent systems in production and what it actually looked like when things went wrong.
Yet another agent orchestrator, but the reviewer-pairing concept is at least novel.
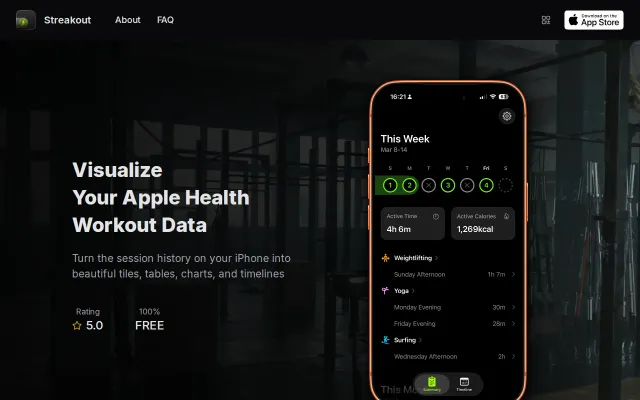
Clean Apple Health viewer, but HealthFit and SmartGym already do this.
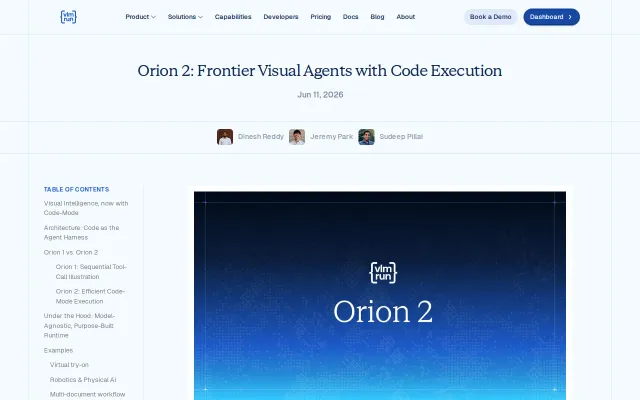
Code-mode orchestration beats sequential tool-calling, but it's a funded product in a crowded AI agent space.
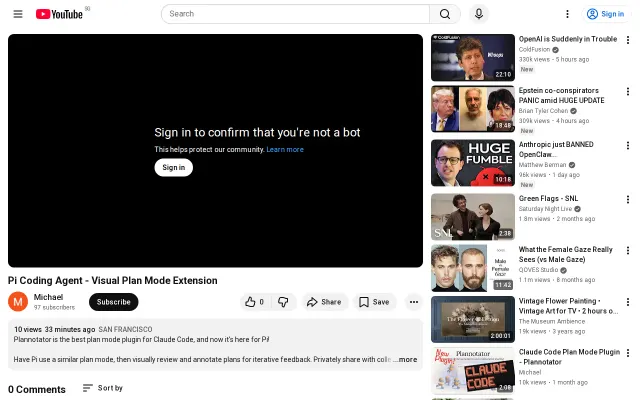
Plan-mode plugin for Pi Coding Agent, but existing Claude Code version already exists.
Auto-detects Claude Code sessions and streams agent decisions as interactive node graphs.
Grammar of Graphics for streaming data, but D3/Observable/Grafana already dominate.