Back to browse
GitHub Repository

Make your OpenClaw agents better, cheaper, and faster.

36 starsTypeScript

Visualizing OpenClaw runs to debug flaws and token spikes

by songrenchu·Apr 14, 2026·1 point·0 comments

AI Analysis

●●SolidSolve My ProblemShip It

Born from burning 40× token budget — finally visible agent execution traces.

Strengths
  • Token usage per step exposes runaway context windows before they compound costs
  • Ask Tracy runs live Cypher queries against trajectory graphs for root cause analysis
  • Three views (tree, call graph, Gantt) cover different debugging mental models
Weaknesses
  • OpenClaw-specific limits audience — not framework-agnostic like LangSmith
  • Agent tracing is emerging space with LangSmith and Arize already established
Category
Target Audience

Developers building agentic workflows with OpenClaw who need debugging visibility

Similar To

LangSmith · Arize Phoenix · Helicone

Post Description

Built a trace view to see OpenClaw LLM / tool / subagent calls and debug it.

Similar Projects

Developer Tools●●Solid

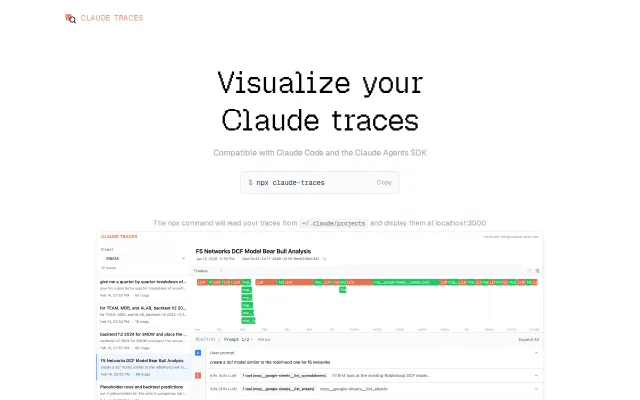
Npx Claude-traces, visualizer for Claude Code/Agent SDK traces

Runs with one npx command and immediately surfaces a helpful timeline view with token counts, tool I/O panes and subagent nesting — exactly the sort of visibility you want when an agent goes off the rails. Cleverly reads the local ~/.claude/projects traces so setup is trivial, but its usefulness is limited by being Claude-only and local; add search/aggregation or a team-sharing mode and this jumps up a tier.

Niche GemSolve My ProblemSlick
hahawhatsgood
204mo ago
Developer Tools●●●Banger

Time-travel debugging and side-by-side diffs for AI agents

Replay, fork, diff, eval agent traces locally—like Git for agent behavior, fills a real gap.

Solve My ProblemShip ItBig Brain
hireclay
103mo ago