AI/ML●●Solid
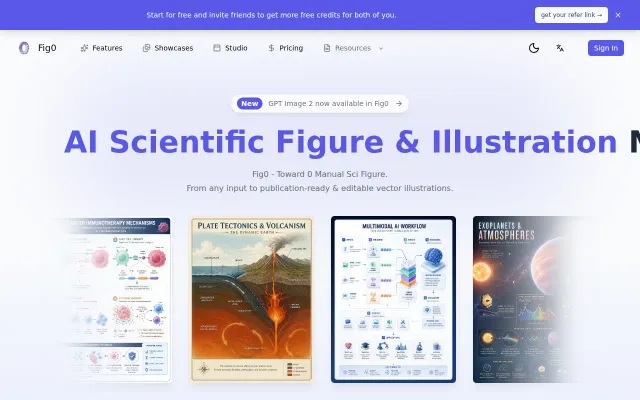
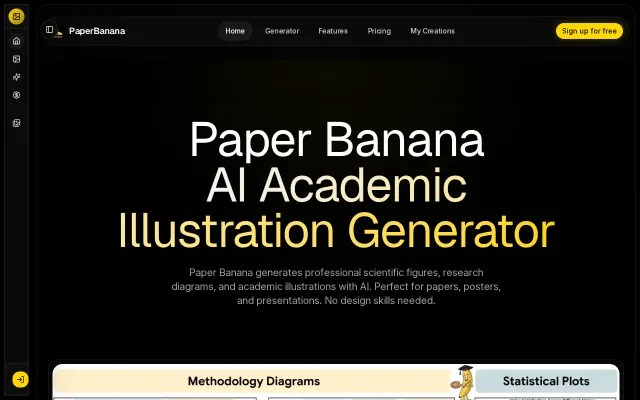
Fig0 – 0-Manual AI Scientific Figure and Illustration Generator
Generates editable scientific vectors from sketches when BioRender requires manual drag-and-drop.
Solve My ProblemSlick
zizheruan
104d ago
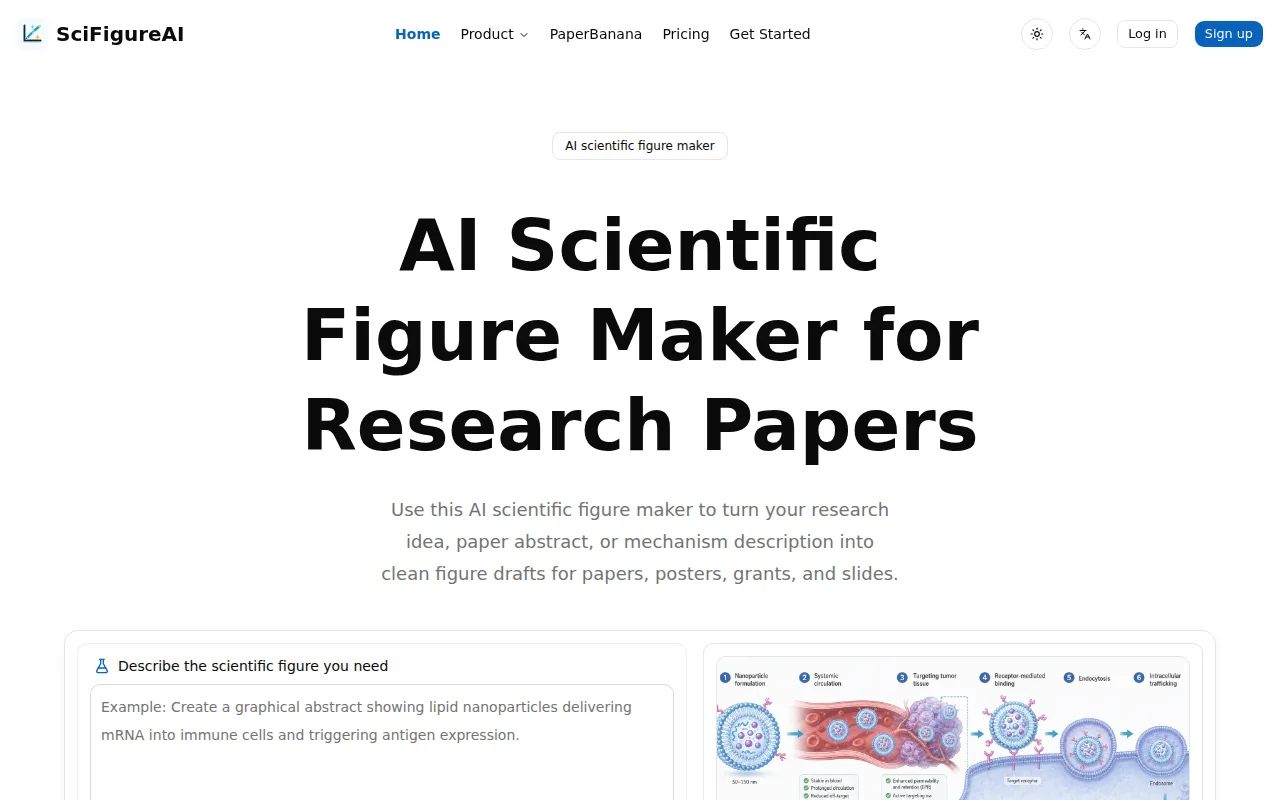
BioRender already dominates this space with better scientific accuracy.
Researchers, academics, scientific authors
BioRender · Mind the Graph · Canva
Generates editable scientific vectors from sketches when BioRender requires manual drag-and-drop.
The product nails a focused niche: text-to-academic-figure workflows with extras like I2I editing, a multi-agent Retriever→Planner→Stylist→Visualizer→Critic pipeline, and explicit support for diagram vs. plot modes. The landing looks tidy and the mention of DDPM/ResNet and plot-code output suggests real engineering under the hood, but the space is crowded (BioRender, generalist image LLMs, fig-helpers) and model transparency, failure modes and export fidelity for journal submission are the open questions.
Cursor for research papers—polished LaTeX tooling with real researcher adoption (9920 users).
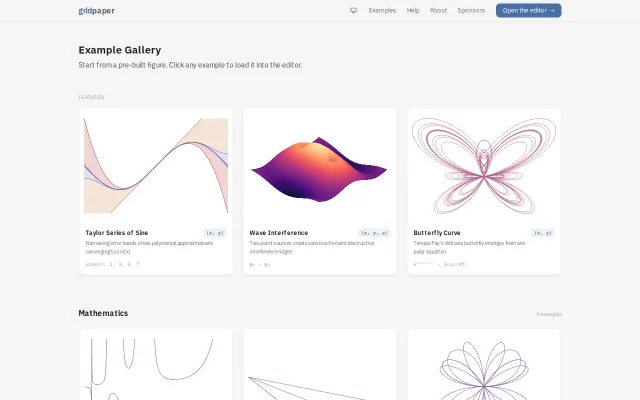
Running gnuplot entirely client-side is the selling point — you get real gnuplot scripting and instant previews without a backend. The examples gallery and interactive parameter controls (e.g. temperature sliders, harmonics/orders) show it’s built for exploration and teaching, not just one-off charts. It’s not trying to out-Plotly Plotly; it instead gives existing gnuplot users a ridiculously convenient, portable playground.
TikTok for papers sounds fun, but researchers need citations, not streaks.
Nature, Elsevier, RSC journal templates save hours of matplotlib formatting.