Data●●Solid
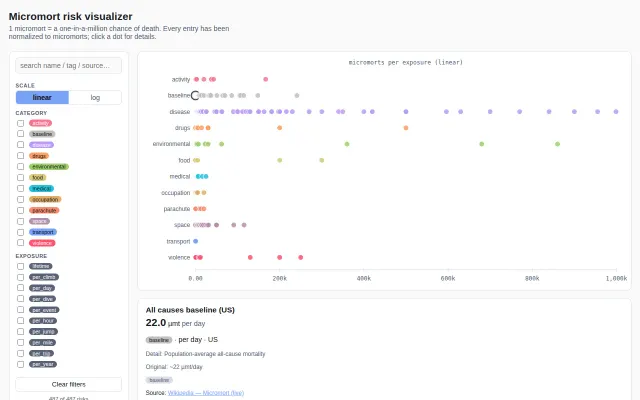
Micromort Risk Visualizer
Sorting 487 risks by danger level is a genuine rabbit hole for the statistically anxious.
Rabbit HoleCozy
boxed
501mo ago
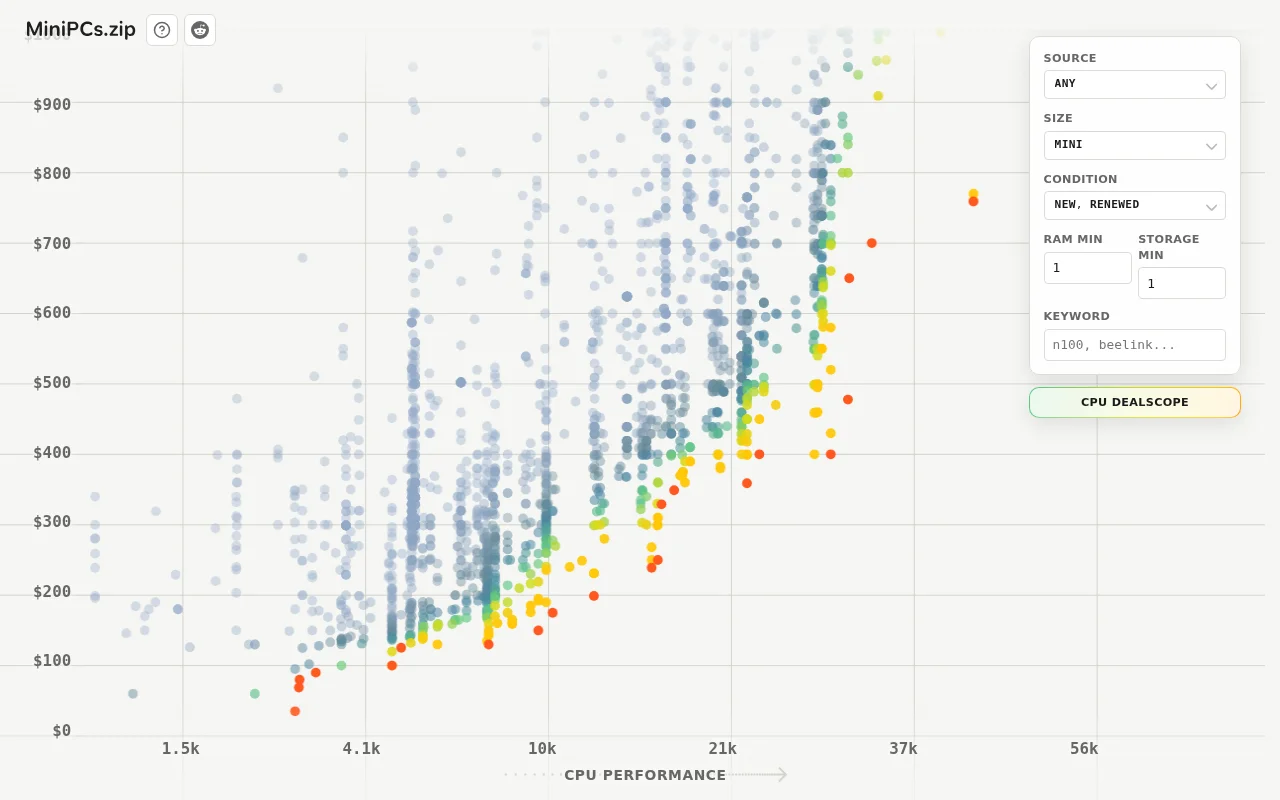
Pareto frontier visualization cuts through thousands of Mini PC listings instantly.
Homelab enthusiasts, Mini PC buyers, hardware comparison shoppers
PCPartPicker · Logical Increments
Sorting 487 risks by danger level is a genuine rabbit hole for the statistically anxious.
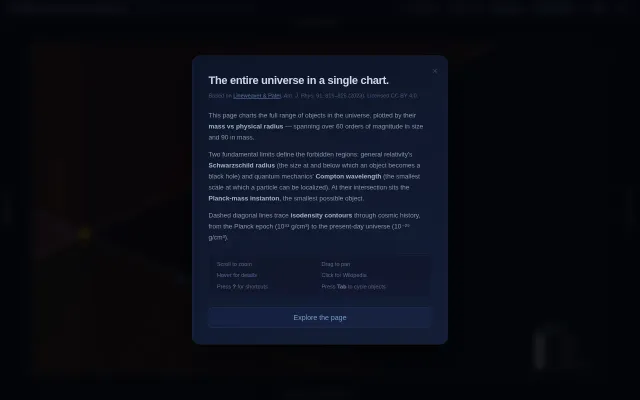
60 orders of magnitude in one scrollable chart with Wikipedia deep-links.
Clean CSV charting, but Datawrapper and Google Sheets already do this free.
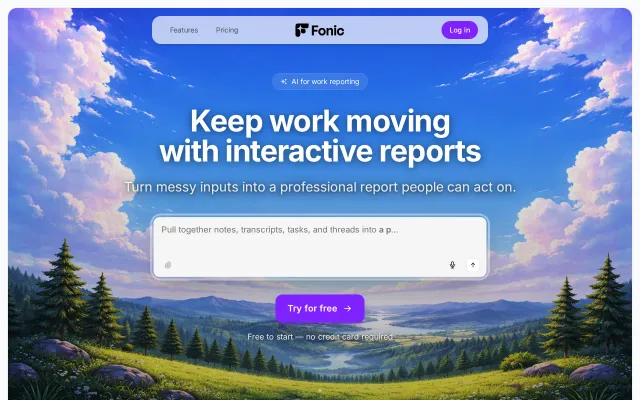
Interactive reports with inline feedback beat static Google Docs for client updates.
First MCP app with interactive fitness UI, but only useful to Garmin+Claude users planning races.
GPU-accelerated immediate-mode plotting for ImGui users tired of hacking Matplotlib.